Understanding the Value of Kennedy Half Dollars: Market Factors, Metal Content, and Collector Demand
The Kennedy half dollar value follows a clear internal logic shaped by metal, condition, mintage, and collector interest. The series covers several production eras, each with its own alloy, strike characteristics, distribution pattern, and survival rate. These shifts define how the market separates common examples from premium pieces.
Value is not fixed. It forms at the intersection of metal content, condition, rarity inside grade, and long-term demand. And a wise approach helps understand where each coin stands and how price groups form across the timeline.
Overview of the Kennedy Half Dollar: Composition, Production, and Market Position
The series is divided into three metal periods:
- 1964 uses a 90% silver alloy and follows classic pre-1965 U.S. coinage.
- 1965–1970 introduced the 40% silver composition used only for half dollars.
- 1971–present shifts fully to a copper-nickel clad alloy.
This transition changes the weight, durability, color, and long-term behavior of the surfaces.
Kennedy halves appear in several production formats: circulation strikes, proof issues, SMS strikes (1965–1967), and NIFC coins (2002 onward). Each format shows its own consistency level and visual signature.
Silver issues carry intrinsic value through melt price. Transitional silver-clad issues form a separate collector segment. Clad issues depend on the condition more than the metal. NIFC pieces remain in collector channels and form a predictable low-premium market.
The broad distribution across decades creates a rich price spectrum. Early silver issues behave like bullion-supported collectibles. Mid-period silver-clad coins show steady demand. High-grade clad issues form a narrow but active market driven by limited survival in MS levels. Proof and SMS coins maintain controlled quality and stable pricing.
Base Value Snapshot: A Structured Table of Market Ranges by Type and Grade
Before examining market behavior, it is useful to outline the typical price groups for each major category. These ranges come from stable public data and current buying patterns. They give a reference point for sorting silver, silver-clad, clad, proof, and NIFC issues.
Each group reflects the combined effect of metal, condition, and overall availability. The table does not replace surface inspection but gives a practical baseline during evaluation.
Market Value Table by Group and Grade
| Type / Group | Common Grades (G–VF) | AU–MS60 | MS63–MS64 | MS65 | Notes |
| 1964 — 90% silver | Melt value ($9–$12) | $12–$18 | $20–$35 | $60–$120 | Strong demand; Accented Hair proof $100–$400+ |
| 1965–1970 — 40% silver | $5–$7 | $8–$12 | $15–$30 | $40–$120 | 1970-D key date: $40–$80; MS65+ $150–$400 |
| 1971–present — clad (circulation) | Face–$2 | $1–$3 | $4–$12 | $20–$60 | MS66–MS67 reach $80–$700 |
| 1965–67 SMS | — | $8–$20 | $20–$35 | — | Strong uniform strikes |
| Proof issues | — | — | $5–$20 | $20–$60+ | Deep Cameo premiums |
| NIFC (2002+) | — | $2–$5 | $5–$10 | — | Low mintages; condition-sensitive |
*These ranges are approximate; specific prices depend on condition, certification (PCGS/NGC), rarity of the variant, and market demand and may change with time.
These ranges outline the core structure of the market. Silver issues follow melt value and premium growth in high condition. Silver-clad pieces form a transitional price group with one key date.
Clad depends almost entirely on grade, with sharp increases for MS65 and above. Proof and SMS coins remain consistent due to controlled production. NIFC issues circulate only through collector channels and show small but steady premiums.
Why Value Changes: Core Market Factors
Value changes because each group reacts to the market in its own way. The structure of the series makes shifts measurable and predictable. Several technical factors matter more than mintage alone.
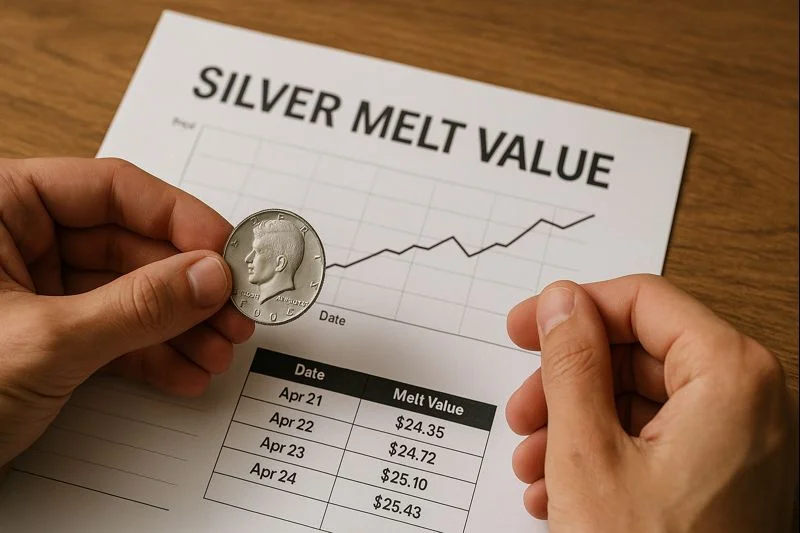
Metal content
Metal defines the lower price boundary. Silver issues track melt value. Surface tone and luster differ across alloys, which affects demand.
- Example: The 1964 half follows the silver spot price; when the spot rises from $20 to $28, the melt value increases accordingly.
Grade and preservation
Condition drives the strongest price differences. Clad coins in MS65+ show substantial jumps due to limited survival. Silver issues show steady curves across grades, but premium levels depend on strike quality.
- Example: A 1971-D in MS64 sells for a few dollars; the same coin in MS66 can exceed $150 because few survive clean enough to grade that high.
Strike quality
Certain years show softer details. SMS and proof issues provide consistent results. Strike strength influences eye appeal and collector interest.
- Example: Many 1973 circulation strikes show weak hair detail, while 1966 SMS pieces display full sharpness and uniform luster.
Mintage vs. survival
High mintage does not guarantee supply in top condition. Large parts of the circulation output show heavy wear.
- Example: The 1976 bicentennial half had enormous production numbers, but MS66 pieces remain scarce due to bag marks and soft strikes.
Collector demand
Demand for 1964 silver remains strong. Demand for 1970-D stays stable due to limited distribution. High-grade clad coins attract competitive buying because of their scarcity.
- Example: A 1970-D sees continuous premium levels because it was never released for circulation and appears only in mint sets.
But the good news is that during sorting, a coin identifier can help place pieces into broad metal and year groups before detailed inspection.
How Identification Shapes Value Assessment
Identification influences value because each design element points to the metal, year, mint, and strike type. These markers place a coin into clear price groups and separate common pieces from those that show collectible traits.
- Mint marks help determine scarcity.
The 1970-D issue is the clearest example of a restricted Denver release. - Surface diagnostics confirm varieties.
Accented Hair, 1972-D No FG, and 1974-D DDO rely on specific features that shift the price range. - The metal group sets the starting level.
Silver tracks melt value, while clad depends almost entirely on condition. - Strike type shapes market expectations.
Proof, SMS, and NIFC show different textures, rim detail, and reflectivity.
Coin ID Scanner can be your practical choice. It shows metal type, year range, basic specifications, and minting details. It shortens the first evaluation step, but grading and variety confirmation still require direct visual inspection.
Long-Term Pricing Patterns and Market Behavior
Pricing forms through consistent patterns repeated across decades.
Silver prices create a baseline for 1964 and 1965–1970 issues. These groups track bullion trends with additional premiums for condition and varieties.
Clad issues behave differently. Their value depends on grade rather than metal.
Large jumps occur between MS64 and MS65. MS66 and MS67 create narrow, competitive markets due to limited survival.
Proof and silver proof issues remain stable. Cameo and Deep Cameo contrast add further separation inside the proof category. SMS pieces remain predictable because of consistent strike quality.
NIFC issues occupy a controlled segment. Mintages are low, circulation is absent, and demand remains steady among collectors of modern series.
These long-term patterns help differentiate short-term price movements from structural value.
FAQs
- Why do some Kennedy half dollars show value above the melt price?
Premiums appear due to strike quality, condition rarity, and recognized varieties. Silver sets the baseline, but high-grade or scarce issues exceed it.
- Which years show the most stable pricing?
1964, the entire 1965–1970 group, 1970-D, SMS issues, and strong proof classes show consistent behavior and predictable demand.
- Do clad Kennedy halves have collectible value?
Yes, but mainly in MS65+. Lower grades stay close to face value due to high surviving populations.
- How much does the mint mark influence value?
Mint marks define distribution differences. Denver in 1970 is the clearest case. Mint marks also assist in separating common dates from premium coins.
- What affects proof prices the most?
Surface quality, presence of Cameo or Deep Cameo contrast, and resistance to spotting. Sharp rims and fully mirrored fields support higher pricing.
- Can circulation finds still have value?
Yes. Early silver issues remain valuable. Scarce varieties can also appear in circulation, provided diagnostic details are visible.
- How can I check the value quickly if I don’t understand grading?
You can use the best free coin identifier app for fast recognition. Coin ID Scanner reads metal, production range, and key parameters from a single photo. It provides basic market orientation and helps place the coin inside the correct value group. Final evaluation still requires a clear inspection of wear and surface quality.
Clear Signals Behind Kennedy Half Dollar Pricing
The value of a Kennedy half dollar follows a simple structure once the metal group, condition, and production format are understood. Each segment of the series reacts to the market in its own way, but the core patterns stay stable across decades. Silver issues form the foundation. Transitional years add their own pressure points. Clad pieces reveal how grading separates common material from scarce high-grade survivors.
Collectors who recognize these signals read the series more confidently. Metal shows the baseline, strike quality shows potential, and condition determines the final level. With this attitude, any Kennedy half dollar becomes easier to classify, compare, and add a specific piece to a collection.